

In 2021, ESOMAR, the leading global market research industry organization, invited Rogier Verhulst (LinkedIn’s Head of Market Research) and I to present at ESOMAR’s annual conference. The topic: Building and Measuring Trust at LinkedIn. The accompanying white paper, co-authored by Rogier, LinkedIn’s Sean O’Connor, Protagonist’s Becky Owens and myself, was selected as a finalist for ESOMAR’s Paper of the Year.
In this post, I’ll hit some of the key points of that paper, focusing especially on Protagonist’s Trust Index, a KPI that incorporates the myriad drivers of trust in your market space into a single metric companies can use to monitor trust health, compare to competitors and set strategic goals.
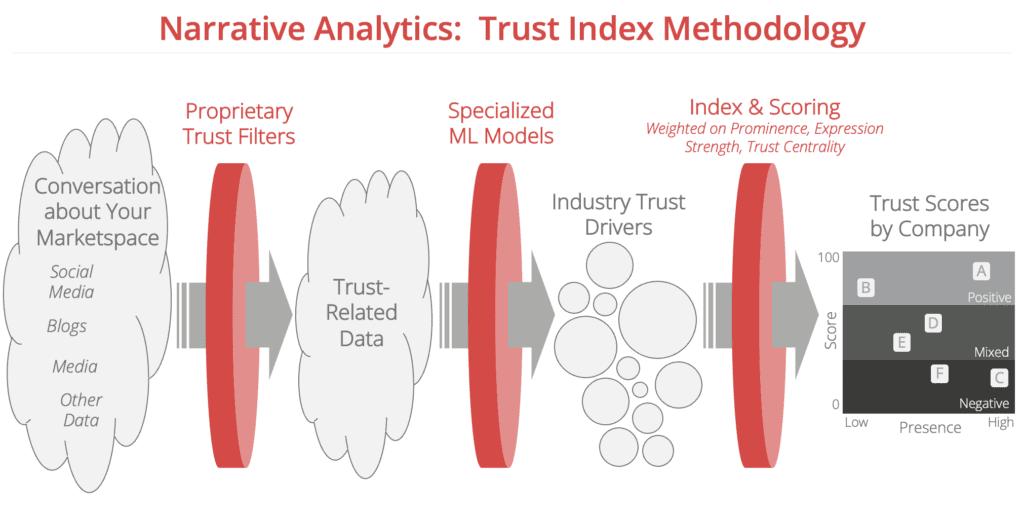
To understand the Trust Index, it’s first important to understand our overall Trust Analytics methodology. Here’s how we do it:
Step 1: Isolating the Industry’s Trust Conversation
For the investigation of trust in any industry, the first major challenge is identifying the conversation and acquiring the relevant data. Relevant expressions are those that meet two criteria: they are about the industry, and they have something to do with trust. For each of those criteria, Protagonist uses a set of data definition and NLP techniques to surface the relevant conversation. The process, implemented by our narrative experts, usually involves an iterative implementation of query development and query testing using particular topic modeling, clustering and other data analysis techniques that we have determined over time to be most effective. Though part of this process involves filtering out irrelevant “noise,” we are careful at this stage to retain narrative rich data that may be filtered out using alternative, simpler methods. Key to success in this stage is including a broad set of parameters that capture the variety of ways people may be indicating that their expression is about the industry and/or the concept of trust. Because this is not the only point where we can filter out irrelevant content, we err on the side of casting a wider net at this stage.
In the LinkedIn case, the result was hundreds of millions of expressions about the industry and trust covering the previous 12 months.
Step 2: Surfacing the Drivers of Trust
In any industry, there will be a set of issues that generate or undermine customer trust. For companies, the first key is to understand what the different drivers of trust (or distrust) are. Oftentimes companies know many of the drivers that have already been affecting their business, but are less aware of emerging drivers, the relative importance of each driver, how drivers interact with one another, and how important different drivers are when looked at multidimensionally.
To surface the drivers of trust, Protagonist begins to apply ML to the problem. Unlike keyword-based approaches, ML offers the advantage of being better able to capture the myriad ways people express a particular idea. For instance, ML can classify each of the following as expressing the idea that Data Security is important to maintaining customer trust:
- “I really wish I knew if my data was safe at [company]”
- “It’s like none of these companies have a clue about how to protect PII”
- “The problem with tech companies is that they are too vulnerable to hacking”
- “I swear if I hear one more story about a breach, I’m going to cut the cord on social media”
Establishing ML algorithms to classify expressions is an iterative process carried out by Protagonist’s narrative experts. As with Step 1, the team uses iterative NLP techniques to identify potential drivers and exemplar expressions for each driver. Using a set of confidence metrics, the team increases the accuracy of each driver’s ML model to increase accuracy of classification. As each driver’s model is established, the team further classifies the full data set, leaving smaller and smaller portions of the corpus remaining to be classified. When the remaining corpus has become sufficiently small, we then apply a proprietary Narrative Richness metric to the remaining data points, to ensure that we are identifying any expressions that, despite being lower signal, are part of the trust conversation.
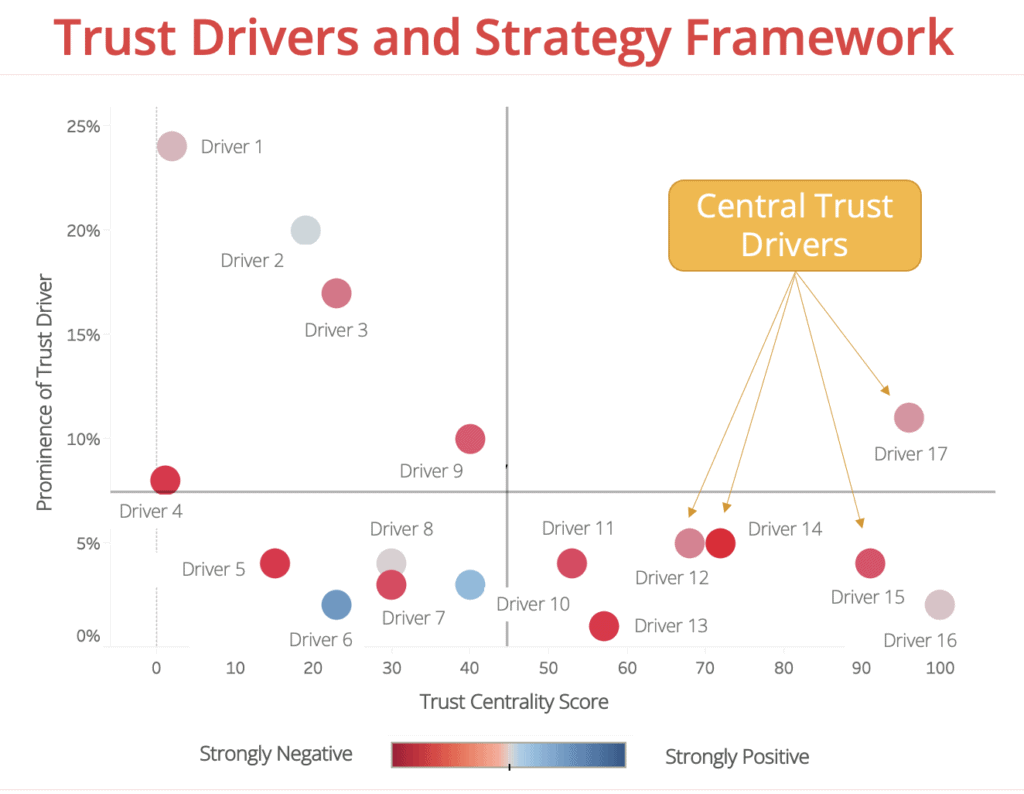
The end result is a set of trust drivers, defined analytically by the ML model for each, that captures all the Narrative Rich expressions in the trust conversation for the industry. In LinkedIn’s case, Protagonist identified 17 different drivers of trust in the technology and social media conversation, ranging from Data Security to Fake News to Technology Addiction.
Step 3: Quantifying and Evaluating the Narrative Landscape
With the ML models established, Protagonist then classifies the entire data set with the models, which results in a number of expressions assigned to each trust driver. This basic quantity can be expressed both as a percent of the overall trust conversation and an absolute figure—both metrics are useful in describing to the client the prominence of the driver.
Though prominence is the single most important metric for the client to understand, it is by no means the only one to pay attention to. Protagonist also analyzes the classified data set using a number of proprietary techniques and metrics, to reveal insights based on several dimensions, including:
- Reach: the degree to which each expression has an audience, based on the prominence of the media or social media source.
- Engagement: how often each expression is engaged with through sharing, likes, comments and other actions.
- Impact: a metric that combines Prominence, Reach and Engagement into a single figure that captures the overall size of the driver in the conversation.
- Intensity of Sentiment: a metric that captures the degree of positivity or negativity of each expression.
- Trust Centrality: the measurement, based on linguistic associations in the data, of how closely people are associating the driver with the idea of trust.
- Growth Trajectory: trends, seasonal patterns, and predictive modeling that anticipates which trust drivers are likely to be the most important going forward.
- Event Correlation: what events occurred as each trust driver gained Impact during the period, and therefore what types of events are likely to cause similar spikes if they occur again.
- Associations: the degree to which the client and competitors are connected to each trust driver.
Using these insights, Protagonist establishes a summary evaluation framework to enable the client to determine which trust drivers are most important to act on in the near term and to monitor most closely ongoing.
For LinkedIn, Protagonist identified 4 Central Trust Drivers, of the 17 total trust drivers, as areas for strategic focus (for confidentiality reasons, we will not list which 4 here).
Step 4: Establishing a Trust Index
To help senior leadership understand how the company is performing on the trust dimension, and to measure progress in a succinct way, Protagonist invented a summary metric called the Trust Index. The Trust Index, calculated for both the client and competitors, serves as a Key Performance Indicator score that can be included on KPI dashboards along with other critical measures of company success.
Protagonist works collaboratively with clients to establish the Trust Index calculation to balance the various factors described in a way most appropriate for the situation, taking into account all of the insights from the baseline analyses in Step 3. In the LinkedIn case, we focused on the following areas:
- Driver Balance: taking various factors into account, the degree to which each trust driver should figure into the Trust Index score calculation.
- Source Balance: the balance of first-person expressions (on social media and forums) and expressions in traditional media, based on the interplay between these two types of sources in the particular Narrative Landscape.
- General Sentiment – Headlines: because of the nature of media consumption, which often focuses only on headlines, and the concise nature of headlines, incorporation of general sentiment in media headlines (even if the headline does not explicitly mention a trust driver).
The Trust Index score takes the general form
TIS = p1(FP) + p2(M) + p3(GS)
In the equation TIS is Trust Index Score; FP is the First Person score; M is the Media score; GS is the General Sentiment – Headlines score; and p1, p2, and p3 are the a priori weights defined for each component (defined in collaboration with the client). FP, M and GS are on a 0 to 100 scale, and the a priori weights sum to 1, resulting in a TIS KPI that is also on a 0 to 100 scale.
For FP and M, Protagonist collaborates with the client to establish calculations in the following form:
FP (or M) = q1(TD1) + q2(TD2) + q3(TD3) + … + qn(TDn)
In the equation the q factors signify the a priori weight assigned to each trust driver and TD represents each Trust Driver’s positive contribution to Trust. Each TD is scaled from 0 to 100 and takes into account a proprietary combination of metrics such as Trust Centrality and Intensity of Sentiment.
Protagonist uses the equations above to calculate industry averages for FP, M, and GS. To calculate company-specific trust index scores, Protagonist uses the following:
TISc = p1(FPc) + p2(Mc) + p3(GSc)
FPc (or Mc) = q1(TD1)(I2c) + q2(TD2) (I2c) + q3(TD3) (I3c) + … + qn(TDn) (Inc)
In the equation, the c subscript denotes the particular company. The I factors represent the Impact for that company for each Trust Driver, as a percentage of the overall Impact for the company in the Narrative Landscape (Impact, again, is a combination of Prominence, Reach and Engagement). The result, again, is a TIS score for each company on a 0 to 100 scale.
Using the Trust Score calculation, Protagonist was able to provide LinkedIn with a Trust Score comparison for 2 industries: high technology companies in general and social media companies in particular.
Enabled with the Trust Index, LinkedIn can use Trust Analytics to keep a “finger on the pulse” of the conversations in media and on social media, for two purposes. First, LinkedIn can monitor its Trust Index Score, to understand how that KPI is fluctuating and why. This enables LinkedIn to respond to fluctuations among the known quantities in the trust landscape
And second, LinkedIn can use Narrative Analytics to highlight emerging issues, creating an Early Warning System for developments that may affect trust perceptions, when those developments are in their early stages. As the following diagram illustrates, new issues and threats can emerge gradually, over multiple time periods.
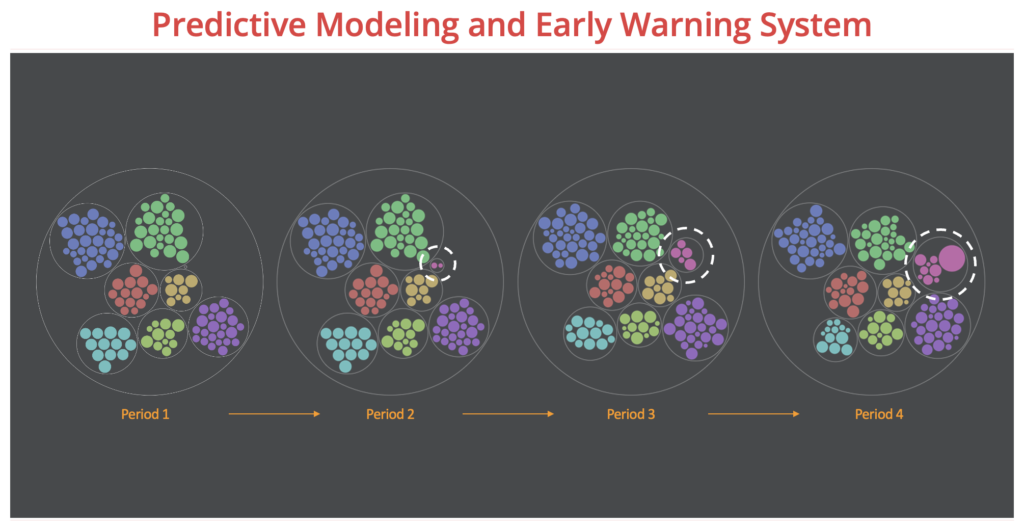
Casual observers, and most companies, would not catch an issue until it is in Period 4 in the diagram, of a critical mass, and much harder to respond to. With Narrative Analytics, lower signals can be detected in Period 2 and monitored to see if they grow in Period 3. Having the early warning in Period 2 gives LinkedIn the time to understand the issue and establish plans for responding well before Period 4.
Turning Insights into Action
With these insights into customer trust, LinkedIn is able to act in data-driven ways to build, maintain and increase customer trust. Because of the strategic and confidential nature of the topic, we are not able to describe specific actions LinkedIn has taken based on Narrative Analytics and the other techniques. However, we can list the following types of actions that companies like LinkedIn have taken based on similar insights:
- Product: Update products and services with features that meet the needs expressed by customers in general, and target audiences in particular, in the data.
- Content: Generate web destinations, blogs posts, webinars, videos and more to connect with and nurture prospects, and to respond to customer concerns and requirements expressed in the Narrative Landscape.
- Brand and Strategy: Based on existing associations of companies with different characteristics, build on positive perceptions and differentiate from competitors by occupying beneficial “white space.”
- Strategic Communications and Public Affairs: Proactively communicate and respond to events in a consistent way, informed by data and insights into how people think about trust-oriented issues and how they have responded in the past.
- Additional Research: Deepen traditional research (focus groups, interviews and surveys) by using Narrative Analytics to inform research design.
In Summary
Trust is a vital commodity for companies to foster and grow. However, to date most companies have not included trust as a KPI because, as the adage goes, “you can’t manage what you can’t measure.” Thanks to the explosion of digital expressions online, increased access to data, and advances in Machine Learning and Natural Language Processing, trust can now be measured and managed.
To do so, companies must leverage techniques like Narrative Analytics to surface and understand all the drivers of trust in each particular context. Bolstering that initial understanding with traditional research can enhance a company’s ability to plan and respond to trust developments effectively. And using Narrative Analytics to recognize threats and opportunities early helps companies to lead their industries in the earning and maintenance of trust.
Given these developments, we expect trust will become a KPI for most B2C companies within the next decade, and for new methodologies like Narrative Analytics to become a standard tool in company toolkits to understand and monitor this vitally important asset.